Example: Postage Rates
Example: Postage Rates |
Click here to open an associated Mathcad worksheet: |

This example lets you fit a curve to data with an exponential trend.
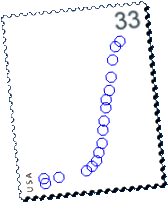
The following table lists first class postage rates (in cents) together with the year in which the rate took effect. The time frame for this data is more than a century.
| Year | Postage (cents) |
Year | Postage (cents) |
||
| 1885 | 2 | 1976 | 13 | ||
| 1918 | 3 | 1978 | 15 | ||
| 1919 | 2 | 1981 | 18 | ||
| 1932 | 3 | 1982 | 20 | ||
| 1958 | 4 | 1985 | 22 | ||
| 1963 | 5 | 1988 | 25 | ||
| 1968 | 6 | 1991 | 29 | ||
| 1971 | 8 | 1995 | 32 | ||
| 1974 | 10 | 1999 | 33 |
Current postal rates are available from the U.S. Postal Service.
|
|
|
| Back to Contents | |