| Example 3: Graphical Rules | Click here to open an associated Mathcad worksheet: |

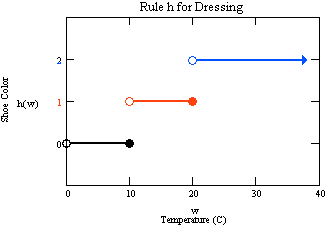
A graph can also represent a rule. Here is a graph for a rule h (in fact, a function h ) which assigns the same values (black, red, blue) to the temperatures w = 10, 20, and 30 as does the function g represented by the table in Example 2. This function, however, is defined for all temperatures w > 0.
The rule h has a larger domain than the rule g . Since h and g agree on their common domain, however, we say that h is an extension of g .
|
|
|
| Back to Contents | |