Example 3: Pollution Rates
Example 3: Pollution Rates |
Click here to open an associated Mathcad worksheet: |

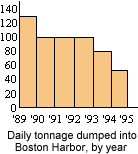
Problem. The graph below gives the approximate amount of solid matter, in tons, dumped daily into Boston Harbor, over the course of a six-year period between 1989 and 1995 1. At what rate did the dumping decrease during this period? Why might this rate be misleading?

Solution. Determining values from a bar graph such as this one is an imprecise business – the number of tons being dumped into the harbor each day may change over the course of a year. The graph apparently displays only one-year averages of the daily values. Thus if T represents the number of tons per day, we can only give approximate values like ![]() 130 tons/day
130 tons/day ![]() 50 tons/day.
50 tons/day.
Our calculations of the change in value,
But the rate is misleading for another reason. It is itself an average rate of change over a six year period. The rate of decrease was actually zero during some years (1990–91, 1991–92, 1992–93) and steeper than –16 tons/day per year in others (1989–90, 1993–94, 1994–95).
|
|
|
| Back to Contents | |