| Example: Brazilian Capybaras | Click here to open an associated Mathcad worksheet: |
 Problem. The populations PT and PM of two colonies of Brazilian capybaras, along the Tapajós and Madeira tributaries of the Amazon River, respectively, have been successfully modeled by the following two functions:
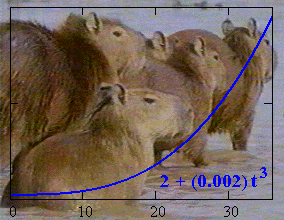
PT (t) = 2 + (0.002) t 3 ,
PM (t) = (1.1) t ;
where the populations are measured in hundreds of capybaras and t is measured in months from the present. When are the two colonies of equal size?
Solution. Since both of the functions are given by algebraic representations – formulas – a natural instinct might be to try to solve the problem using an algebraic method. In algebraic terms, the problem would be to solve the following equation for t :
2 + (0.002) t 3 = (1.1) t .
However, this equation does not have an algebraic solution! (And it isn't because we just don't know how to solve it.) Algebraic methods of solution fail us here.
Does this mean that the problem has no solution?
Before we abandon the algebraic approach entirely, we can use it to gather a clue, if not a complete solution. Notice that right now (t = 0)
PT (0) = 2 + (0.002) (0) 3 = 2 ,
P M (0) = (1.1) 0 = 1 .
That is, the Tapajós colony currently consists of 200 capybaras to the Madeira colony's 100. The only way the two populations will ever be equal at some time in the future is if the Madeira colony outgrows the Tapajós colony. We see that we must look at the long-term behavior of the functions. It is exactly this kind of "big picture" for which another method – the graphical method – is best suited.
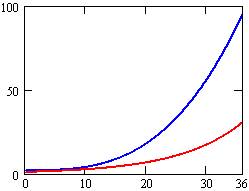
We can plot the two population functions on a calculator or a computer; that is, we can convert our algebraic representations to graphical ones. Over the next 36 months, the plots look like this:

The top (blue) curve represents the Tapajós colony. It appears that the Tapajós colony not only has a head start (observed algebraically above, but not so apparent here), but it is also rapidly outgrowing the Madeira colony. This would seem to settle things: The Madeira colony will never equal the size of the Tapajós colony. Unfortunately, this is the wrong answer.
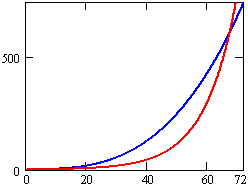
While graphical methods are able to give us the big picture of a function's behavior, there is always the question of how "big" is big enough. If we had looked at the populations for a period of time twice as long, we would have seen the following:

In this view it is apparent that the Madeira population does catch up with the Tapajós population, somewhere between 60 and 70 months from now. We could now use the zooming feature on our calculator or computer to find the intersection point and get a better estimate of the time when the two populations will be the same.
Have we found all of the solutions? You should, at least, be skeptical by now. Perhaps a still larger viewing window would reveal that the Tapajós population eventually retakes the Madeira population. Extending the time scale farther and farther into the future, however, shows no such trend. (What does it show?) After a bit of experimentation in this direction, we may be ready to conclude that the populations are equal only once. Again, we would be wrong.
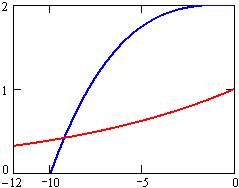
If we extend our models only a short time into the past, we see that the populations were also equal a little less than ten months ago. The plots look like this:

As before, we could get an estimate of this intersection time using the zooming feature on a calculator or computer. Do you think this second intersection accurately represents a time when the populations were equal? Why?
|
|
|
|
| Back to Contents | ||