Vectors
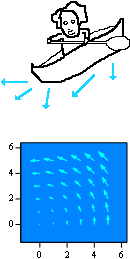
 Suppose that you are navigating a canoe through a treacherous cascade of water and rocks. You need input! To adjust your course, you need to know what the current is doing right where you are, right now. Judging the speed of the current – say, 40 ft/sec – doesn't really give you a complete picture of what is going on. The direction – toward that rock or down that chute – is equally important.
River currents, even at a particular place and a particular time, cannot be described by a single number. They are not scalar quantities. Instead, they are described by a number (speed) and a direction (e.g., 2 o'clock). We call such quantities vectors. Wind, force, and the position of the sun are examples of vector quantities.
To describe an entire river at a particular time means giving vectors, not at one place, but at every place in the river. We say that the river is described by a vector field. To describe a river's changing currents means giving each vector, not once, but as a function of time. The flow of the river is described by vector-valued functions.
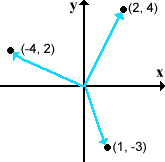
The chemist J. Willard Gibbs is given credit for introducing compact, usable notation for describing vector quantities. His paper, Graphical Methods in the Thermodynamics of Fluids (1873), introduced diagrams like this:

As simple as it appears, this notation was a revelation. The difficulties of describing a quantity with magnitude and direction were reduced to giving a simple pair of coordinates, (x, y), at the tip of an arrow.
Mathematics had seen seen similar revelations in...
- 1637, when Descartes' La Géométrie introduced a coordinate system for the algebraic description of problems in geometry.
- 1690, when Bernoulli first used polar coordinates to give simplified descriptions of many curves and motions.
- 1797, when Wessel's On the Analytic Representation of Direction: An Attempt described complex numbers using a coordinate representation.
Gibbs, like Descartes, Bernoulli, and Wessel before him, had found the numbers at the heart of the problem.
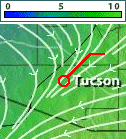
 2D vectors, such as wind directions on a surface (think of weather maps), are given, as above, by two coordinates: (x, y). 3D vectors, such as the winds experienced in an airplane, need a third coordinate to give the location of the arrow's tip: (x, y, z). If we wish to describe these vectors over time, we need a fourth coordinate: (x, y, z, t). And so forth... Beyond three coordinates, geometry fails us, and we can no longer visualize the arrows. No matter. Gibbs' lesson to us is that vector quantities are perfectly well described by appropriate lists of numbers.
 Explore vectors
Lists of numbers, of course, bear a strong resemblence to sequences. Indeed, we often write vectors as (a1 , a2) , (a1 , a2 , a3) , etc., with the understanding that the "general term" an gives the n th component of the vector. Vectors, however, are inherently finite sequences. We do not speak of their "long-term behavior". Vectors do not converge or diverge.
 Suppose that you are navigating a canoe through a treacherous cascade of water and rocks. You need input! To adjust your course, you need to know what the current is doing right where you are, right now. Judging the speed of the current – say, 40 ft/sec – doesn't really give you a complete picture of what is going on. The direction – toward that rock or down that chute – is equally important.

 2D vectors, such as wind directions on a surface (think of weather maps), are given, as above, by two coordinates: