Example 2: Number of U.S. Farms
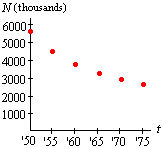
The table below shows the number N of farms in the US, in thousands, at five year intervals between 1950 and 1975.
![]()
For each of the five-year intervals shown, we can compute the change in value and the average rate of change in value for N(t):

| 1950 – 55: | |
| 1955 – 60: | |
| 1960 – 65: | |
| 1965 – 70: | |
| 1970 – 75: |
We see that the change in value DN in each interval is negative, indicating that the function is decreasing. The size (absolute value) of the average rates of change DN/Dt are also decreasing, indicating that the decrease in N is slowing over time. Graphically, a function which is decreasing at a decreasing (absolute) rate is concave up, as a plot of the data shows:

|
|
|
| Back to Contents | |