Example 4: Exchange Rates
Example 4: Exchange Rates |
Click here to open an associated Mathcad worksheet: |
Travelers arriving at Heathrow Airport in London have the opportunity to exchange their dollars ($) for pounds (£). Imagine that you arrive with x dollars to exchange.
The number of pounds y you will receive in return will be some multiple, rx, of the number of dollars, with

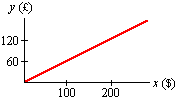
At any particular time the exchange rate is fixed, and the exchange function

You can see that 100 dollars will buy 60 pounds, 200 dollars will buy 120 pounds, and the exchange rate is at
What about the changing exchange rate? We can't picture it as a concavity in this plot. The reason is that the exchange rate varies with time, not x, and we have no way to plot time on a graph of y vs. x.
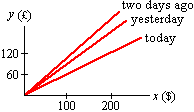
We could do the following, however:

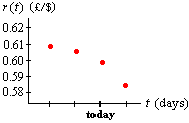
Now we can see that the exchange rate (slope of the line) is decreasing with time, and apparently decreasing at an increasing absolute rate. A plot of r vs. t might look like this:

You'd better sell those dollars today!
|
|
|
| Back to Contents | |