Example 7: Nixon & Inflation
Example 7: Nixon & Inflation |
Click here to open an associated Mathcad worksheet: |
While president, Richard Nixon appeared on television to report the following "good news" to the American people:
"The rate of increase of inflation is going down."
Most people who heard the news understood "going down" (whatever was going down) to be something good.
But... what exactly was "going down"? Costs? Increases in costs? The rate of change in costs? What does it mean for the "rate of increase of inflation" to be going down?
We can better understand the statement if we try to put it in the context of something familiar: Changes in your weekly grocery bill. For a bag of groceries containing a fixed collection of items, a decreasing weekly bill would obviously be good news. An increasing weekly bill would not.
Nixon, however, is talking about a period of inflation, during which costs are increasing. This being the case, a decreasing weekly increase might be considered a kind of good news, however grudgingly. This would mean that a graph of your weekly bills would be going up, but at least it would be concave down.
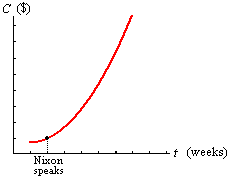
This isn't what Nixon is saying, either. He talks about an "increase of inflation," not a decrease. The weekly increases in your grocery bill are themselves increasing. Thus, the graph of your weekly bills is, in fact, increasing and concave up.
Nixon's optimism is further removed. He isn't talking about decreasing grocery bills. He isn't talking about decreasing increases in grocery bills. He isnt even talking about decreasing rates of increase in grocery bills. He is asking the country to celebrate a decreasing rate of increase in the rates of increase of their grocery bills.
To see this, consider a fixed bag of groceries which costs
Nixon says the "rate of increase" of this quantity is going down. As with any other quantity, its increase is given by
A possible graph for a cost function C(t) which fits this description is shown below. Few people would consider the picture "good news," even grudgingly.

|
|
|
...to Exercises |
| Back to Contents | ||