Exercises
To help you evaluate your understanding of the basic ideas about functions introduced in this lesson, we present here some of the examples in the form of exercises. This first set of exercises should not offer any great challenges if you have worked carefully through this lesson.
Try to answer the questions and write out solutions without returning immediately to the lesson. Solutions are given in the lesson examples.
Use these exercises for review, self-testing, and for practice using functional notation in your descriptions.
Teachers may use these exercises for assignments or classroom discussion.
1. A student writing a term paper notices that she completed her 10th page at 1 am and her 22nd page at 4 am. Suppose
a) What are the values of P(1) and P(4)?
b) What is the change in value, D, between
c) At what average rate has the student been writing between t = 1 and t = 4?
d) What do you expect will happen to DP between
2. As a New Year's resolution, Josh decides to lose some weight. On January 1, he steps on the scale to record his initial weight:
a) What was Josh's change in value, DJ, between
b) At what average rate has Josh been losing weight?
c) How will his rate of weight loss change over the next
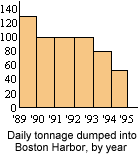
3. The graph below gives the approximate amount of solid matter, in tons, dumped daily into Boston Harbor, over the course of six years.

a) At what average daily rate was the dumping taking place between 1989 and 1990? Between 1994 and 1995?
b) What was the average rate of change in the daily dumping rate between 1989 and 1995?
c) During which years was the average rate of change in the daily dumping rate equal to zero?
d) How do you reconcile your answer in c) with the overall rate of change found in b)?
4. As you leave Boston on the Massachusetts Turnpike, a machine at a toll plaza spits out a card on which the time and place of your entry onto the Turnpike are encoded on a magnetic strip. You throw the card on the floor of your car and, fueled by WMBR and a six-pack of Jolt cola, drive to the other end of the Turnpike at the New York state line. There, a toll attendant swipes the card through another machine, frowns, and asks you to pull over. You are informed that you are being ticketed for exceeding the posted 65 mph speed limit somewhere along the Turnpike, even though no police cars have recorded your speed along the way. Should you fight the ticket? Explain.
5. The following table gives the number N of symphonies that Mozart wrote at age x.

a) Is
b) Find the following values: N(8), N(10), N(14), N(16).
c) What was Mozart's change in symphony production, DN, between the ages of 8 and 10? Between the ages of 14 and 16?
d) At what average rate was Mozart producing symphonies between ages of 8 and 10? Between the ages of 14 and 16?
e) Find a time interval in Mozart's life during which his average rate of symphony production was zero, but during which he actually wrote a great many symphonies.
6. In 1961, after purchasing hundreds of packs of baseball cards all summer, Louisa finally unwrapped the lucky pack that contained the card of her favorite player, Orlando Cepeda. It cost her 5 cents. Over the years, the card accumulated in value, and in 1996 she was offered $50 for the card by a collector.
a) At what average rate has the card accumulated in value over the years?
b) If the card continues to accumulate in value at this same average rate, what will its value be when Louisa retires in 2011?
c) Sketch a graph of the value V(t) of Louisa's card as a function of the number of years t since 1961, under the assumption in b).
d) How would the graph change if the card accumulated in value at an increasing rate over the years? How would this affect the value of the card in 2011?
e) How would the graph change if the card accumulated in value at a decreasing rate over the years? How would this affect the value of the card in 2011?
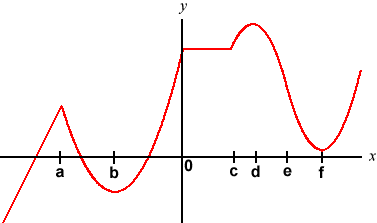
7. In the figure below, give the intervals (or points) on the x–axis where the function is
a) increasing
b) decreasing
c) neither increasing nor decreasing
d) concave up
e) concave down
f) neither concave up nor concave down

8. The table below shows the number N of farms in the US, in thousands, at five year intervals.
![]()
a) For each of the five-year intervals shown, compute the change in value of N(t).
b) For each of the five-year intervals shown, compute the average rate of change in value of N(t) .
c) Which of a) and b) would be considered bad news for US farmers? Why?
d) Which of a) and b) could be considered good news for US farmers? Why?
9. Physicists have found that the velocity of an oil drop, when falling through a vacuum, is well-described by the formula
![]()
where v0 is the drop's initial downward
a) The values of this function are themselves rates of change. Of what? Draw a picture of the falling drop and indicate the quantity that is changing.
b) Is the rate positive or negative? Increasing or decreasing? What does this tell you about the quantity in a)?
c) Sketch a graph of v(t) vs. t.
d) Sketch a graph of the quantity in a) vs. t.
10. Travelers arriving at Heathrow Airport in London have the opportunity to exchange their dollars ($) for pounds (£). Imagine that you arrive with x dollars to exchange. The number of pounds y you will receive in return will be some multiple, rx, of the number of dollars, with
a) Today, $100 will buy £60. Sketch a graph of the exchange function,
b) The exchange rate has been falling steadily for the last few days. On your graph from a), add sketches for possible exchange functions for yesterday and the day before yesterday.
c) How would your answer in b) change if the exchange rate had been falling at an increasing rate in recent days? At a decreasing rate?
d) For each of your three scenarios, sketch a corresponding graph of the exchange rate vs. time.
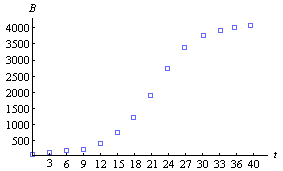
11. The following graph displays the cumulative number of mentions in the New York Times of Barney, a lumpish purple dinosaur once popular with small children. The independent variable t gives the time, in months since January 1 of 1991, and the dependent variable

a) Where does B(t) have the largest value?
b) Over what interval does B(t) show the greatest change in value?
c) Over what interval does B(t) show the greatest average rate of change in value?
d) Explain the significance of each of your answers.
12. While president, Richard Nixon appeared on television to report the following "good news" to the American people: "The rate of increase of inflation is going down."
a) Suppose that the function
b) How would your graph in a) have to change in order to represent an increasing inflation rate?
c) How would your graph in a) have to change in order to represent an increasing inflation rate that was increasing at a decreasing rate ("going down")?
d) Is this "good news"? Explain.
|
|
End. | |
| Back to Contents | ||