| Logarithmic Functions | Click here to open an associated Mathcad worksheet: |
Graphic Representation![]()

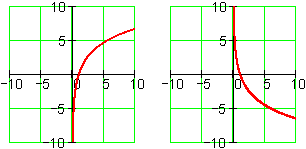
Logarithmic graphs are asymptotic to the y-axis: In the long term, in one direction or the other, they become arbitrarily close to, but never touch, the y-axis.
They live entirely in the half plane to the right of the y-axis.
The curves pull away from the y-axis, increasing at a decreasing rate (less positive) or decreasing at an increasing rate (less negative).
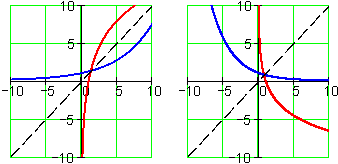
Logarithmic graphs are reflections (mirror images) of exponential graphs. The "mirror" is the line

Only exponential functions
Every logarithmic graph has an x-intercept at (1, 0) . Regardless of a and b ,
The above graphs show just a few of the members of the family of logarithmic functions. To see how these and other logarithmic graphs can be created by tuning the family's parameters, see the associated worksheet.
|
|
|
| Back to Contents | |