| Logistic Functions | Click here to open an associated Mathcad worksheet: |
Graphic Representation![]()

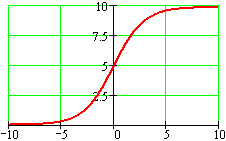
Logistic graphs follow a characteristic S-shape which is often called sigmoidal.
The S shape may either rise from the x-axis to the limiting value, or drop from the limiting value to the x-axis. The limiting value may be raised and lowered, and the rate at which the curve travels between the two horizontal asymptotes may vary, but this basic sigmoidal shape is found in all logistic graphs. (See the section on algebraic representations of logistic functions.)
The above graph shows a single, characteristic member of the family of logistic functions. To see how this and other logistic graphs can be created by tuning the family's parameters, see the associated worksheet.
|
|
|
| Back to Contents | |