One way to get at the implicit functions embedded in a "mixed-up" equation is to graph all of the pairs (x, y) that balance the equation.
For example, we have noted that if
![]()
then
![]()
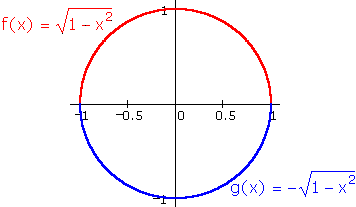
Here the equation implicitly defines two perfectly normal functions, and it is a simple matter to plot them together:

Other cases are harder. For example,
![]()
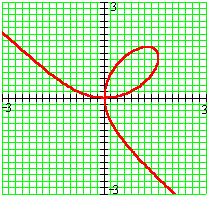
This is the famous Folium of Descartes. While there is an algebraic method for solving this equation for the various functions that give y in terms of x , the results are extremely complicated.
To produce a graph of such an equation, we can divide a region of the xy-plane into a very fine grid. At each point (x, y) on the grid, we can plug the coordinate values into both the left and the right sides of the equation. If the two sides agree (within some pre-set tolerance), we add the point to the plot. If the two sides do not agree, we don't. This method may seem tedious and time consuming, but it is the kind of thing for which computers are tailor-made.
Here's a plot of the Folium of Descartes, produced in this manner:

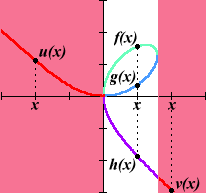
We see that the equation divides the xy-plane into three regions. Along the "tails" y can be given as an explicit function of x , but in the x neighborhood of the "loop" three separate functions of x are implicitly defined:

|
|
|
|
| Back to Contents | ||